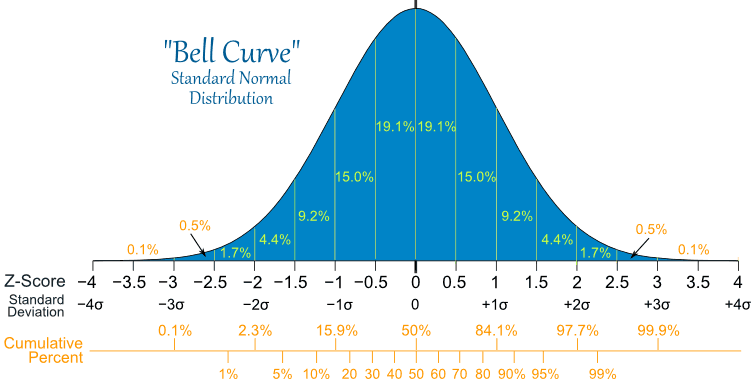
The Standard Deviation is a measure of how spread out numbers are (read that page for details on how to calculate it).
When we calculate the standard deviation we find that (generally):
 |
68% of values are within
1 standard deviation of the mean
95% of values are within
2 standard deviations of the mean
99.7% of values are within
3 standard deviations of the mean |
It is good to know the standard deviation, because we can say that any value is:
- likely to be within 1 standard deviation (68 out of 100 should be)
- very likely to be within 2 standard deviations (95 out of 100 should be)
- almost certainly within 3 standard deviations (997 out of 1000 should be)
Standard Scores
The number of standard deviations from the mean is also called the "Standard Score", "sigma" or "z-score".
Example: In that same school one of your friends is 1.85m tall
You can see on the bell curve that 1.85m is 3 standard deviations from the mean of 1.4, so:
Your friend's height has a "z-score" of 3.0
|  |
It is also possible to calculate how many standard deviations 1.85 is from the mean
How far is 1.85 from the mean?
It is 1.85 - 1.4 = 0.45m from the mean
How many standard deviations is that? The standard deviation is 0.15m, so:
0.45m / 0.15m = 3 standard deviations
So to convert a value to a Standard Score ("z-score"):
- first subtract the mean,
- then divide by the Standard Deviation
And doing that is called "Standardizing":

We can take any Normal Distribution and convert it to The Standard Normal Distribution.
Example: Travel Time
A survey of daily travel time had these results (in minutes):
26, 33, 65, 28, 34, 55, 25, 44, 50, 36, 26, 37, 43, 62, 35, 38, 45, 32, 28, 34
The Mean is 38.8 minutes, and the Standard Deviation is 11.4 minutes (you can copy and paste the values into the Standard Deviation Calculator if you want).
Convert the values to z-scores ("standard scores").
To convert 26:
first subtract the mean: 26 - 38.8 = -12.8,
then divide by the Standard Deviation: -12.8/11.4 = -1.12
So 26 is -1.12 Standard Deviations from the Mean
Here are the first three conversions
| Original Value | Calculation | Standard Score (z-score) |
| 26 | (26-38.8) / 11.4 = | -1.12 |
| 33 | (33-38.8) / 11.4 = | -0.51 |
| 65 | (65-38.8) / 11.4 = | +2.30 |
| ... | ... | ... |
And here they are graphically:

You can calculate the rest of the z-scores yourself!
Here is the formula for z-score that we have been using:
Example: Professor Willoughby is marking a test.
Here are the students results (out of 60 points):
20, 15, 26, 32, 18, 28, 35, 14, 26, 22, 17
Most students didn't even get 30 out of 60, and most will fail.
The test must have been really hard, so the Prof decides to Standardize all the scores and only fail people 1 standard deviation below the mean.
The Mean is 23, and the Standard Deviation is 6.6, and these are the Standard Scores:
-0.45, -1.21, 0.45, 1.36, -0.76, 0.76, 1.82, -1.36, 0.45, -0.15, -0.91
Only 2 students will fail (the ones who scored 15 and 14 on the test)
It also makes life easier because we only need one table (the Standard Normal Distribution Table), rather than doing calculations individually for each value of mean and standard deviation.
|


No comments:
Post a Comment